
Matter42
  • Vision
Sign in

Matter42 Atlas

  • Atlas Metrology
  • Atlas Physics AI

Resources

  • Security
  • FAQ
  • Documentation
  • Python SDK

Company

  • Team
  • Careers
  • Blog
Vision
Sign in
Atlas Metrology

Every measurement, analyzed the same way

Atlas Metrology reads any instrument file format, runs analysis you can review, and keeps the figure, the numbers, and the method attached to the sample that produced them.

Raman_mapping.txt · WS₂, PFIB-patterned · 532 nm1,080 spectra × 1,600 ch
E₂g + A₁g intensity, regions from segment_regions45 × 24 px
10 µm
Pixel 1 spectrum, pseudo-Voigt fitcm⁻¹
E₂gA₁gSi200300400500
E₂g
350.1
FWHM 14.6
A₁g
417.8
FWHM 5.9
Si
521.0
FWHM 10.3

WS₂ E₂g signal at 100% of intact material.

A Raman map of a plasma-FIB-patterned WS₂ flake, segmented and peak-fit by Atlas.

One workspace for every technique

Pick the metrologies your lab runs. Each has its own analysis, and all of them share one sample record.

Every analysis Block
  • Raman

    Raman spectroscopy

    Automated spectral peak analysis and material identification, connected to models of strain and defectivity.

    Learn more
  • Photoluminescence

    Photoluminescence spectroscopy

    Spectral analysis for band-gap extraction and identification of material-specific features.

    Learn more
  • XPS

    X-ray photoelectron spectroscopy

    Automated, constrained core-level fitting and bonding-state identification for film thickness, composition, charging, and band alignment.

    Learn more
  • XRD

    X-ray diffraction

    Phase, size, strain, texture, rocking curves, and φ-scan twin fractions from one diffractometer session.

    Learn more
  • AFM

    Atomic force microscopy

    Recorded leveling, roughness, island counts and step heights, line profiles, and QNM mechanics from one scan.

    Learn more

Materials decisions depend on more than one measurement

Useful characterization lives across Raman peaks, PL maps, microscope images, sample history, and literature notes. Atlas Metrology keeps that evidence together and makes the reasoning reproducible.

  1. 1

    Evidence stays attached

    Every figure, number, and caveat stays linked to the files and samples that produced it, so any result can be checked later.

  2. 2

    Specialist analysis, built in

    Purpose-built tools turn spectra and maps into numbers you can verify, instead of leaving interpretation to a generic chatbot.

  3. 3

    One shared record

    Scientists, process engineers, and reviewers work from the same project, so nobody rebuilds context from scratch.

From raw files to defensible results

The same four steps for every sample, whoever runs them.

  1. 1

    Upload as measured

    Drop in vendor files from Raman, PL, XRD, AFM, and XPS instruments. Atlas parses them without reformatting or copy-paste.

  2. 2

    Ask in scientific language

    The assistant picks the right analysis, cites the files it used, and explains how the answer follows from the data.

  3. 3

    Compare across samples

    Maps, clusters, region masks, and quality metrics stay comparable across runs, tools, and teammates.

  4. 4

    Hand off the result

    Spec checks, reports, and figures go out with their method and calibration status, ready for review.

Pairs with Atlas Physics AI

When the question is why, not what

Atlas Metrology tells you what you made. Atlas Physics AI models how the process got you there, from atomistic defects to reactor-scale flux, and checks its predictions against the same measurements.
Explore Atlas Physics AI

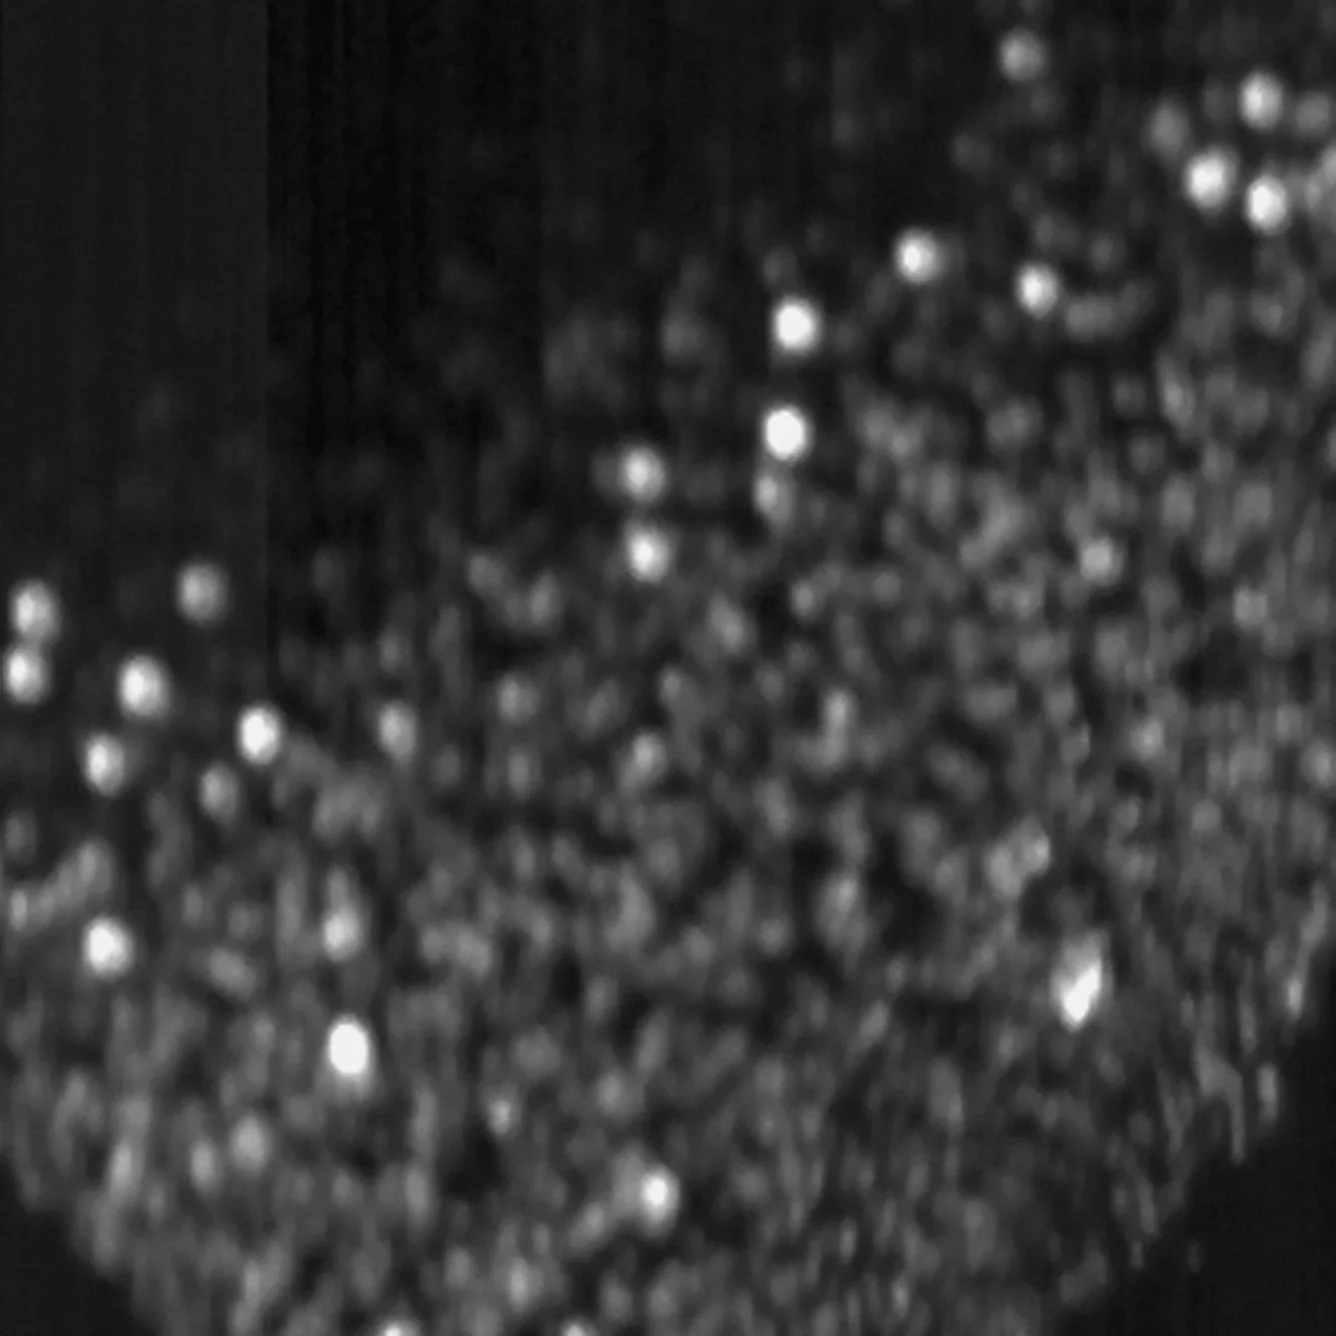
GaAs/GaAsP nanowire micro-PL · Patel et al. 2023

Bring a measurement, see the result

Have Raman or PL maps, an XRD pattern, or an AFM scan you need to interpret? We’ll run it through Atlas Metrology with you and show what comes back.

Read the docs
Matter42

A world model for your materials: know what you made and decide what to make next, with the evidence attached.

Platform

  • Atlas Metrology
  • Atlas Physics AI
  • Literature

Software

  • Raman analysis
  • PL analysis
  • XPS analysis
  • XRD analysis
  • AFM analysis

Company

  • Vision
  • Team
  • Careers
  • Blog

Resources

  • Documentation
  • Python SDK
  • Security and deployment
  • FAQ

Legal

  • Privacy Policy
  • Terms and Conditions

Social

  • LinkedIn

Copyright © 2026 Matter42. All rights reserved.

Matter42
  • Vision
Sign in

Matter42 Atlas

  • Atlas Metrology
  • Atlas Physics AI

Resources

  • Security
  • FAQ
  • Documentation
  • Python SDK

Company

  • Team
  • Careers
  • Blog
Vision
Sign in
Atlas Metrology

Every measurement, analyzed the same way

Atlas Metrology reads any instrument file format, runs analysis you can review, and keeps the figure, the numbers, and the method attached to the sample that produced them.

Raman_mapping.txt · WS₂, PFIB-patterned · 532 nm1,080 spectra × 1,600 ch
E₂g + A₁g intensity, regions from segment_regions45 × 24 px
10 µm
Pixel 1 spectrum, pseudo-Voigt fitcm⁻¹
E₂gA₁gSi200300400500
E₂g
350.1
FWHM 14.6
A₁g
417.8
FWHM 5.9
Si
521.0
FWHM 10.3

WS₂ E₂g signal at 100% of intact material.

A Raman map of a plasma-FIB-patterned WS₂ flake, segmented and peak-fit by Atlas.

One workspace for every technique

Pick the metrologies your lab runs. Each has its own analysis, and all of them share one sample record.

Every analysis Block
  • Raman

    Raman spectroscopy

    Automated spectral peak analysis and material identification, connected to models of strain and defectivity.

    Learn more
  • Photoluminescence

    Photoluminescence spectroscopy

    Spectral analysis for band-gap extraction and identification of material-specific features.

    Learn more
  • XPS

    X-ray photoelectron spectroscopy

    Automated, constrained core-level fitting and bonding-state identification for film thickness, composition, charging, and band alignment.

    Learn more
  • XRD

    X-ray diffraction

    Phase, size, strain, texture, rocking curves, and φ-scan twin fractions from one diffractometer session.

    Learn more
  • AFM

    Atomic force microscopy

    Recorded leveling, roughness, island counts and step heights, line profiles, and QNM mechanics from one scan.

    Learn more

Materials decisions depend on more than one measurement

Useful characterization lives across Raman peaks, PL maps, microscope images, sample history, and literature notes. Atlas Metrology keeps that evidence together and makes the reasoning reproducible.

  1. 1

    Evidence stays attached

    Every figure, number, and caveat stays linked to the files and samples that produced it, so any result can be checked later.

  2. 2

    Specialist analysis, built in

    Purpose-built tools turn spectra and maps into numbers you can verify, instead of leaving interpretation to a generic chatbot.

  3. 3

    One shared record

    Scientists, process engineers, and reviewers work from the same project, so nobody rebuilds context from scratch.

From raw files to defensible results

The same four steps for every sample, whoever runs them.

  1. 1

    Upload as measured

    Drop in vendor files from Raman, PL, XRD, AFM, and XPS instruments. Atlas parses them without reformatting or copy-paste.

  2. 2

    Ask in scientific language

    The assistant picks the right analysis, cites the files it used, and explains how the answer follows from the data.

  3. 3

    Compare across samples

    Maps, clusters, region masks, and quality metrics stay comparable across runs, tools, and teammates.

  4. 4

    Hand off the result

    Spec checks, reports, and figures go out with their method and calibration status, ready for review.

Pairs with Atlas Physics AI

When the question is why, not what

Atlas Metrology tells you what you made. Atlas Physics AI models how the process got you there, from atomistic defects to reactor-scale flux, and checks its predictions against the same measurements.

Explore Atlas Physics AI

GaAs/GaAsP nanowire micro-PL · Patel et al. 2023

Bring a measurement, see the result

Have Raman or PL maps, an XRD pattern, or an AFM scan you need to interpret? We’ll run it through Atlas Metrology with you and show what comes back.

Read the docs
Matter42

A world model for your materials: know what you made and decide what to make next, with the evidence attached.

Platform

  • Atlas Metrology
  • Atlas Physics AI
  • Literature

Software

  • Raman analysis
  • PL analysis
  • XPS analysis
  • XRD analysis
  • AFM analysis

Company

  • Vision
  • Team
  • Careers
  • Blog

Resources

  • Documentation
  • Python SDK
  • Security and deployment
  • FAQ

Legal

  • Privacy Policy
  • Terms and Conditions

Social

  • LinkedIn

Copyright © 2026 Matter42. All rights reserved.